
Autosomal DNA testing has become an increasingly popular tool in everyone’s genealogy toolbox these days, but I’ve noticed that there are many everyday family historians who are still bewildered by their DNA test results and aren’t really sure what to make of them. For many genealogists, high school biology classes are a distant memory, so the language of genetic genealogy is foreign. Comments like, “What’s the point of DNA testing? I already know I’m 100% Polish-American,” remind me of how far we need to go in educating people about the value in looking beyond those ethnicity estimates so that they can really make use of their test results. With all that in mind, I thought it might be helpful to review some of these basic concepts in genetic genealogy and present some strategies for the absolute beginner to use when confronted with a list of autosomal DNA matches. If you’re already comfortable working with your DNA match lists, and you’re looking for a blog post with cutting-edge information written by an acknowledged expert in the field of genetic genealogy, then this post is not for you. But if you’re one of those people who’s scratching his head wondering how all these people could show up in the match list when they’re not in the family tree, then keep reading.
Going Beyond the Ethnicity Estimates
Biogeographical analyses, also known as admixture analyses or “ethnicity estimates” are a big draw these days, and are the primary motivation for DNA testing for many. Eager to learn whether they should trade in their lederhosen for a kilt, many people pore over their ethnicity breakdowns, and don’t pay much attention to their lists of DNA matches. That’s a shame, because the real value of DNA testing lies in those lists of matches, which offer evidence that will allow you to extend and support your documentary research. The underlying assumption of DNA testing is that the people on your match list are your genetic cousins, whether or not you know at this point how you are related to them. There’s a significant caveat, which we’ll get to in a moment. However, generally speaking, if you match a particular individual to whom you have a known relationship, and if the amount of DNA you share is consistent with the known relationship, it suggests several things:
- That the paper trail is correct from you to the most recent common ancestral couple that you share with this DNA match.
- That the paper trail is also correct from your DNA match to that same most recent common ancestral couple.
- That the matching segments of DNA shared between you and this person were passed down to each of you from that most recent common ancestral couple.
To illustrate, let’s say that I have a maternal first cousin once removed named Fred. (I do, actually, and I have his permission to use his name in this post.) Fred is the son of my maternal grandmother’s brother, Leon. Fred and I share 544 centiMorgans of DNA across 28 segments, according to Ancestry. A centimorgan (cM) is a unit of genetic linkage that is commonly used to express genetic distance, so the more DNA you share with a match in centimorgans, the more closely you’re related. Since 544 cM of DNA is within the range that first cousins once removed can be expected to share, we can say that the DNA evidence supports the documentary evidence. That is, the proposed, documented parentage shown in Figure 1 is also borne out by DNA evidence, so there are no misattributed parentage events in my line back to my great-grandparents, Jan/John Zażycki and Weronika/Veronica Grzesiak, and there are no misattributed parentage events in Fred’s line back to that same couple.
Figure 1: Relationship chart showing documented relationship between me and cousin Fred.
Misattributed parentage events (also known as non-paternity events, or NPEs) can occur in a family for a number of reasons, such as informal adoption, illegitimacy, marital infidelity, surname change, etc., and they can sometimes come as quite a shock to people who test their DNA and suddenly discover that their lineage isn’t what they thought it was. Similar discoveries can also be made with documentary research, of course, so anyone who is considering DNA testing or genealogy research should be prepared for the possibility of such surprises. However, in the example above, no NPEs were found (whew!), so now we have both genetic and documentary evidence to prove that cousin Fred and I are first cousins once removed.
If we download the raw data from Ancestry and upload it to a site that offers a chromosome browser, such as GEDmatch, we can visualize where each matching segment is located on each chromosome, as shown in Figure 2.
Figure 2: Matching DNA segments (shown in blue) between me and Cousin Fred, courtesy of GEDmatch Genesis. Only data from Chromosomes 1, 2 and 3 are shown here.
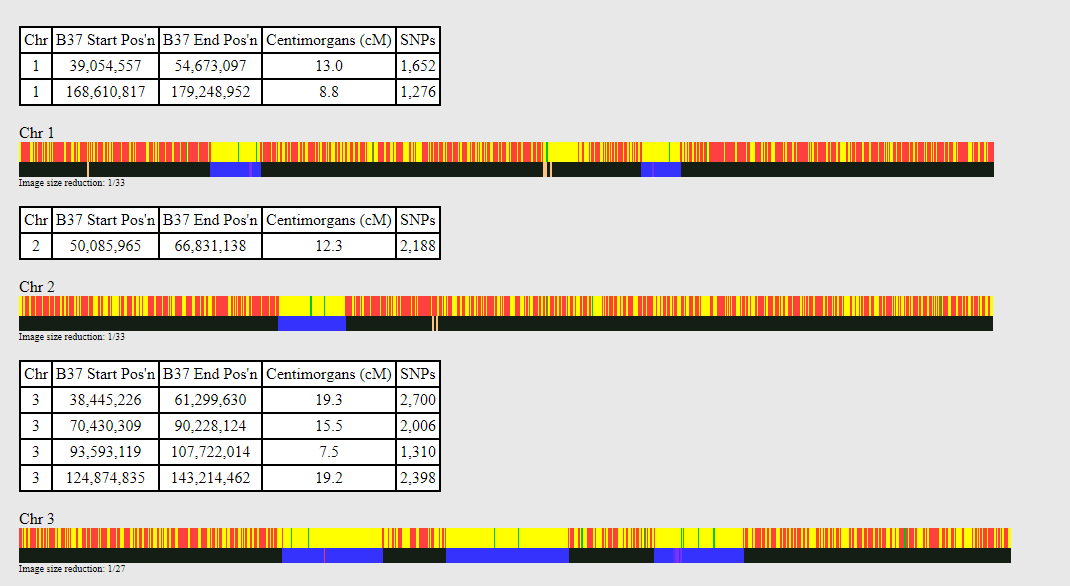
Each of those blue segments is presumed to be identical by descent (IBD). That is, Cousin Fred and I each carry those specific DNA sequences because we inherited them from a common ancestor. Based solely on these data, it’s not possible to know which of these segments was inherited from Jan Zażycki and which was from Weronika Grzesiak, but we know they had to come from that ancestral couple. Now let’s say we identify a hypothetical third cousin, Joe. Let’s suppose that we have documentary evidence to prove that Joe descends from Weronika Grzesiak’s brother Tadeusz. Moreover, let’s say that Joe matches Fred and me on Chromosome 2 along that segment shown in blue. If that were the case, we would call it a triangulated segment, and we could state confidently that the common ancestor from whom Fred and I inherited that bit of DNA was Weronika Grzesiak and not Jan Zażycki.
Chromosome Mapping with DNA Painter
Analysis like this supplies the foundation for creating chromosome maps like the ones that can be generated quickly and easily at DNA Painter. Each time you use documentary evidence to verify your relationship to one of the genetic cousins from your match list—assuming you also have segment data for the match—you can paint the segment(s) onto your chromosome map. Currently, all of the major test companies except Ancestry offer chromosome browsers and segment data that can be used for chromosome mapping. So if you test with Family Tree DNA, MyHeritage, or 23 & Me, you’re good to go. However, if you determine your relationship to a cousin found in your match list at Ancestry, you cannot paint the match onto your chromosome map unless you can persuade that person to download his or her raw data from Ancestry and upload to Family Tree DNA, MyHeritage, or GEDmatch Genesis. (23 & Me does not currently accept uploads from other companies.) So although it’s intellectually satisfying to document your relationship to a DNA match found on Ancestry, the lack of segment data is a serious drawback, and these matches are useless for chromosome painting. My current map is shown in Figure 3.
Figure 3: My chromosome map, generated by DNA Painter.
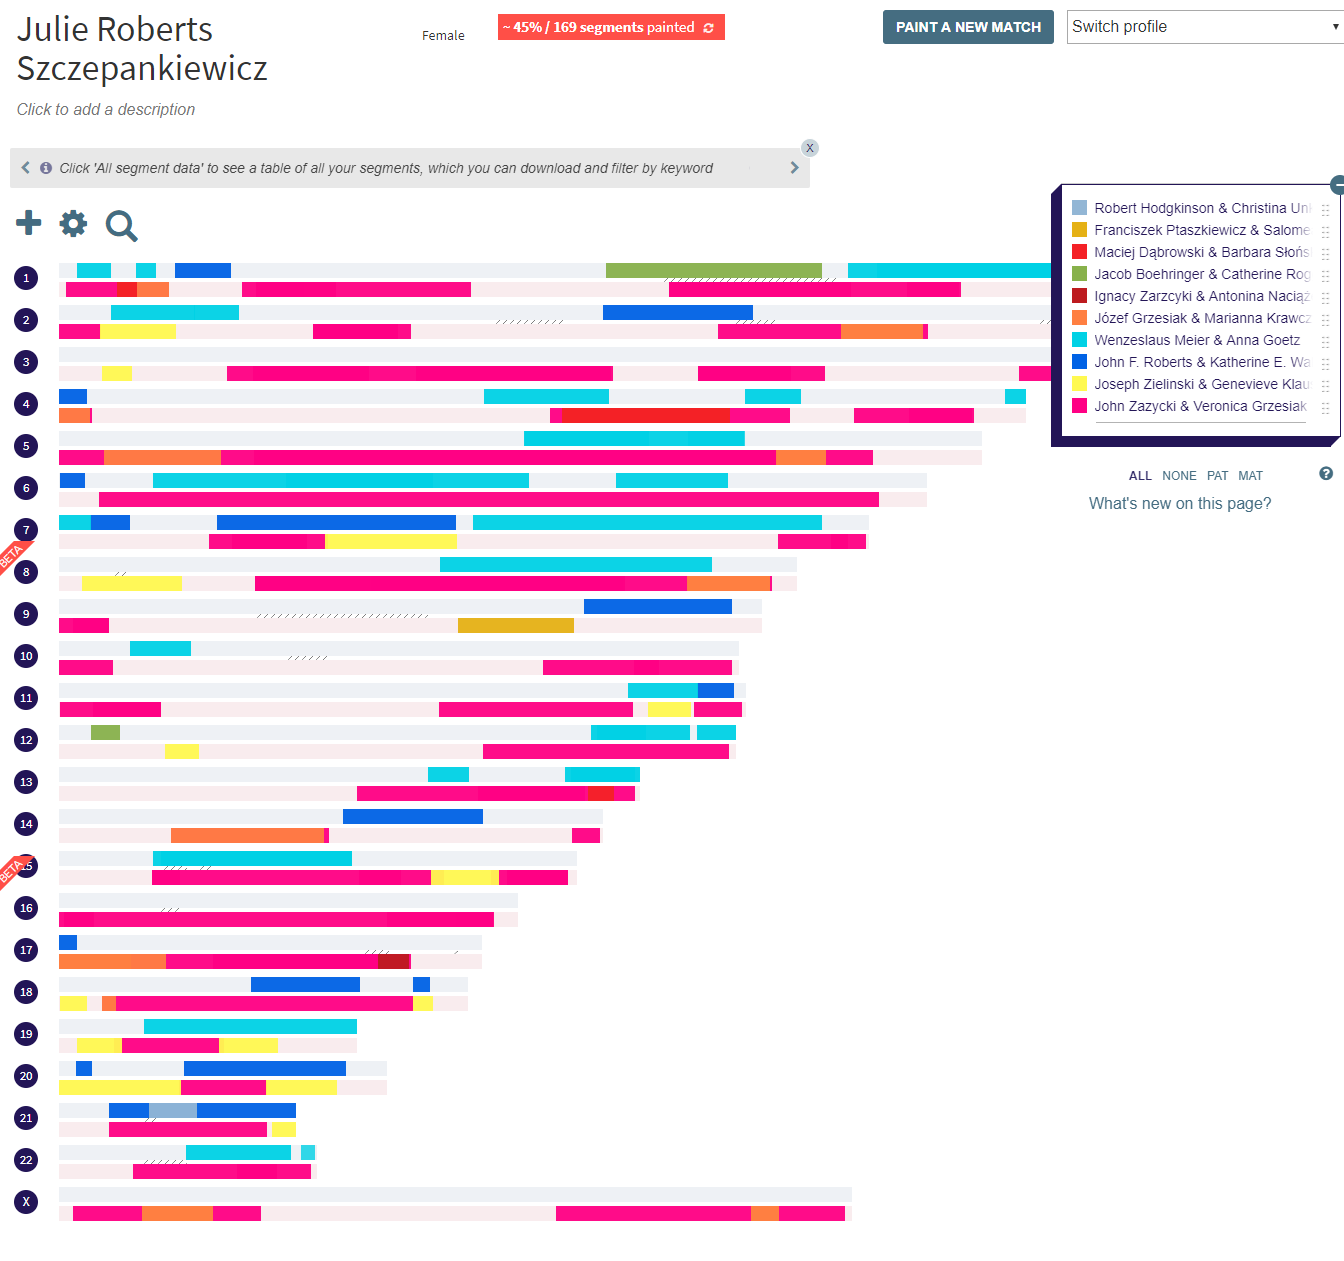
If you look closely at the map, you see that each chromosome is represented by two bars that appear next to the chromosome number on the left. The upper bar is lightly shaded in blue and represents the copy of that chromosome which I inherited from my father. The lower bar is lightly shaded in pink, and represents the copy of that chromosome which I inherited from my mother. Superimposed on those base colors are darker-colored segments which are defined in the key on the right. For example, there’s a dark pink color that indicates DNA I inherited from my great-grandparents, John Zazycki and Veronica Grzesiak. I know I inherited this DNA from them because all of those dark pink segments represent DNA shared between me and my late grandmother, their daughter. I tested Grandma before she passed (thank you, Grandma!), and these are the segments where she and I matched. This is important information, because it implies that the segments of my maternal (light pink) chromosomes that are not shaded in dark pink must have been inherited from my maternal grandfather. The entire light pink chromosome came from my Mom, and all of her DNA came from either her mother or her father. So if I know from empirical evidence which segments came from her mom, I know by deduction which segments came from her dad.
Those dark-pink segments inherited from Grandma can be further refined, since all of her DNA was ultimately inherited from her mother’s ancestors and her father’s ancestors. You’ll notice that chromosomes 1, 4, and 13 show red bars superimposed on that dark pink. These red bars indicate DNA segments that I inherited from Grandma’s great-great-grandparents, Maciej Dąbrowski and Barbara Słońska. Maciej was born about 1775, and Barbara was born circa 1781, and I find it utterly amazing and fascinating that I can pinpoint at least some of the bits of my own DNA that were inherited from one or the other of them. Figure 4 shows a close-up of a portion of my chromosome map, where the red bar indicating DNA inherited from Maciej and Barbara is especially visible on Chromosome 4.
Figure 4: Closer view of my chromosome map showing red segment on maternal Chromosome 4, corresponding to DNA inherited from 4x-great-grandparents Maciej Dąbrowski and Barbara Słońska, indicated by black arrow.
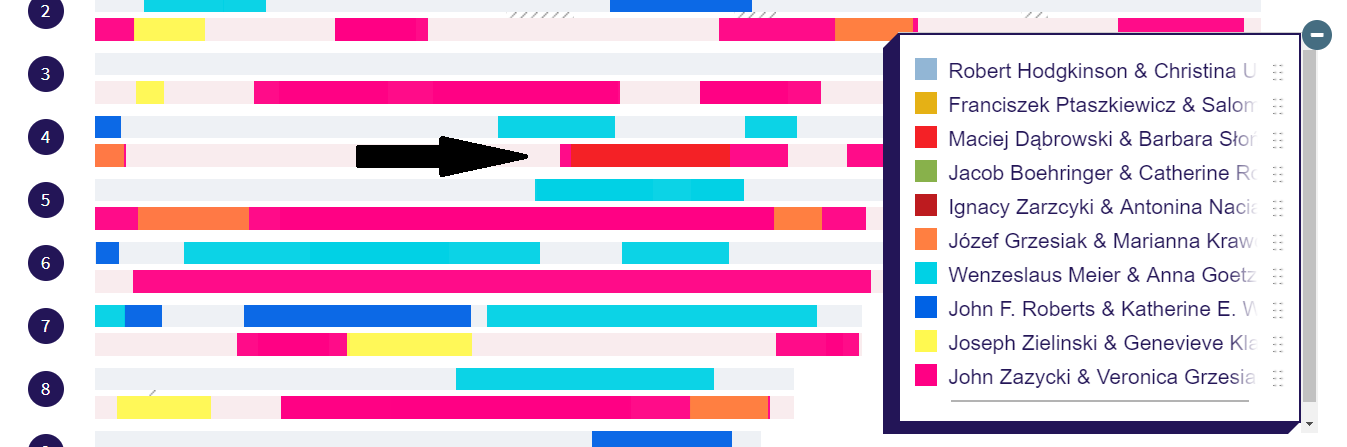
DNA Painter offers the additional option of a closer look at each individual chromosome. If we focus on Chromosome 4, we can see the breakdown of Grandma’s dark-pink segments as I’ve been able to map them to date (Figure 5).
Figure 5: Expanded view of Chromosome 4 showing underlying ancestral contributions to each dark-pink segment inherited from Grandma.
I’ve removed the names of my living DNA matches to protect their privacy. However, each of those red bars represents a match to a 5th cousin who is a documented descendant of Maciej Dąbrowski and Barbara Słońska. The orange bar represents a match to a second cousin once removed (2C1R) who is a documented descendant of Maciej and Barbara’s great-granddaughter, Józefa Grzesiak (my Grandma’s aunt). This means that the segment of DNA which Grandma inherited (pink bar) which overlaps with the segment of DNA inherited by my 2C1R (orange bar) came from either Maciej Dąbrowski or his wife Barbara, and was passed down to at least two of their great-granddaughters—both my great-grandmother, Weronika Grzesiak, and well as her sister Józefa Grzesiak—who ultimately passed it down to me and my 2C1R. There may be other descendants who share this bit as well, who haven’t yet tested their DNA.
Ultimately, this bit of DNA, or any of the other bits of Grzesiak DNA carried by documented Grzesiak descendants, might someday be the key to identifying unknown cousins from Poland. Weronika and Józefa had at least one sister, Konstancja, who remained in Poland, married, and had at least two children whom I’ve identified through documentary research. Thanks to a fortuitous marginal note on a baptismal record, I know that one of these children married in Lower Silesia in 1927. Unfortunately, it’s not currently possible for me to know if there were any children from that marriage, because Polish privacy laws protect birth records for a period of 100 years. However, if a descendant from that marriage were to test his or her DNA, it’s quite likely that he or she would show up as a match to me or one of those other Grzesiak descendants. With any luck, that hypothetical cousin might be interested in collaborating to confirm the match, through documentary research. As next-of-kin, Polish law would permit him to request the recent birth, marriage or death records to which I have no access.
These segment data also illustrate how matches to more-distant cousins can refine our understanding of matches to closer relatives. My match to Grandma tells me that the DNA underlying that pink bar in the middle of maternal Chromosome 4 comes from one of her parents, John Zażycki or Veronica Grzesiak, but it doesn’t tell me which one. My match to my 2C1R tells me that the subset of that Zażycki/Grzesiak DNA, underlying the orange bar, comes from Veronica Grzesiak because I’m related to that cousin through the Grzesiaks and not through the Zażyckis. This suggests that the DNA on either side of that segment, represented by the pink tips that extend past the orange on the left and the right, might have been inherited from John Zażycki. However, it’s impossible to know that definitively at this point, because some future DNA match might prove me wrong.
If I only had data from Grandma and that 2C1R, I would know that the DNA segment represented by the overlap between the orange and the pink bars had to come from either Józef Grzesiak or his wife, Marianna Krawczyńska, but I would not know which one contributed it. However, thanks to those DNA matches to my fifth cousins (a set of siblings), I know that the DNA segment represented by the overlap in pink, orange and red bars must have been inherited from Józef Grzesiak and not Marianna Krawczyńska, because those fifth cousins are related to me through Józef Grzesiak’s grandparents, Maciej Dąbrowski and Barbara Słońska, and not through the Krawczyński side. The more DNA matches you can identify, the deeper you can drill down into your DNA, because every bit of DNA in your body, no matter how small, had to come from one ancestor or another. Theoretically, you should be able to go through your list of DNA matches and identify the ancestors responsible for passing along even the tiniest fragments of DNA shared between you and a match, right?
IBD or…Not?
Unfortunately, it’s not quite that simple. It may not be possible to determine your relationship to every single one of your DNA matches. It’s not a perfect world and I don’t know anyone who has his family tree traced back to 6x- or 7x-great-grandparents on every single line. Moreover, there’s always the possibility of an NPE or two (or more!) in each person’s tree, which would throw a monkey wrench into the analysis. Furthermore, some of the DNA matches who show up in our match list may not be related to us at all through common descent in the genealogical time frame. This is that caveat I mentioned earlier, and it’s true regardless of the company you test with. Although DNA testing is predicated on the assumption that your matches share common ancestry with you due to inherited DNA segments that are identical by descent (IBD), not every DNA segment that is identified as a match by the test company’s algorithm is IBD. What else could they be?
Any DNA match that is not IBD is sometimes described as IBS, “Identical by State.” However, IBS is something of a catch-all term, because it encompasses matches that are Identical by Population (IBP), as well as Identical by Chance (IBC). Let’s take a closer look at these two possibilities. There are some segments of DNA that you will share with people just because your ancestors and their ancestors came from the same endogamous population, meaning a community in which intermarriage between distant (or not-so-distant) cousins was common. These are typically small segments of DNA (<10 cM) that will not be possible to assign to a particular ancestor within the genealogical time frame—that is, within the time frame in which it’s possible to find documentary evidence to confirm the relationship. Such segments are often referred to as Identical by Population (IBP). The other possibility is that the DNA segment identified as a match by the test company is a false positive, also known as a pseudosegment. To understand how this can happen, we need to take a closer look at the methodology behind DNA testing.
The Nuts and Bolts of Autosomal DNA Testing
Autosomal DNA testing focuses on the tiny differences in our genetic makeup that make us unique. Most of our genetic code is identical, of course, but there are places in the human genome where slightly different forms of the same gene can exist. These different forms of the same gene are called alleles. DNA is made up of chemical units called nucleotides, and each nucleotide in the DNA is referred to by a letter (A = adenine, T = thymine, G= guanine, C = cytosine), and each time one letter is substituted for another at a particular place in the DNA sequence, it’s called a Single Nucleotide Polymorphism, or SNP (pronounced “snip”). There are 4-5 million SNPs in the human genome, and each of the DNA test companies samples between roughly 630,000-700,000 of them.1 Figure 6 shows an extract of my raw DNA data file (called a genotype) as downloaded from Ancestry.
Figure 6: Extract from my genotype from Ancestry showing SNPs on Chromosome 2.

The raw data file includes some additional columns which I’ve omitted, and I’ve obscured the data in the column that identifies the precise position on Chromosome 2 where these SNPs are located. The letters to the right of the position column indicate the nucleotide found at that position on each copy of my Chromosome 2. Note also that only half the DNA is shown here. If you remember from high school biology class, DNA exists as paired strands, so every time there’s an A, it’s paired with a T, and every C is paired with a G. However, this report only provides information on one strand from each parent.
The sequence of the data looks nice and neat, and one might assume that the left column represents data from maternal alleles while the right column represents data from paternal alleles. However, the reality is that the test cannot distinguish between maternal and paternal alleles at any given position. The data in the genotype are intermixed, and therein lies the problem. Although all of the test companies use algorithms which can successfully sort out the data and identify matching segments of DNA between individuals, the accuracy of the matching algorithms decreases significantly when they attempt to identify smaller segments of DNA as matches. The result is that a large percentage of small “matching” segments (less than 7 cM) reported by the test companies are not IBD, they’re Identical by Chance (IBC), or false positives. Roberta Estes offers a more detailed discussion of these types of matching (IBD, IBS, IBC, and IBP),2 and if you really want to delve into the nitty gritty, you can read Ancestry DNA’s Matching White Paper3 which explains how their matching algorithm works in technical terms.
The Big Problem of Small Segments
So how big a problem is this? Genetic genealogist Tim Janzen estimates that there is only a 5% likelihood that a shared segment of 6-12 cM indicates a common ancestor within the last 6 generations for you and your DNA match.4 You can see his full table here. That same article states that, “False positive matching rates of between 12% and 23% have been reported for Family Finder data [Family Finder is the autosomal DNA test offered by Family Tree DNA], and up to 34% at Ancestry using their current algorithm.” 5 Yikes! So how can we know if a match is real or not? One possibility is to test not only yourself, but both your parents. Since all your DNA must come from either one parent or the other, any DNA match who matches you, but who does not also match one of your parents, cannot be your genetic relative. If both parents aren’t available for testing, the safest thing to do is to avoid basing genealogical conclusions on evidence from small segments. Consider restricting your analysis to segments larger than 10 cM. This is good advice even if you do have phased data—that is, data which have been compared to both your mother’s data and your father’s data using a tool such as the Phased Data Generator, available as a Tier 1 utility at GEDmatch Genesis.
To illustrate the problems with small segments, consider the following example. Figure 7 shows a 9 cM segment on Chromosome 22 which is shared by a DNA match, “Czesław C.” along with my mother (EZR), my grandmother (Helen Zielinski), my sister (AW), and me.
Figure 7: Matching segment (shown in blue) shared by Czesław C., my mother, my grandmother, my sister, and me, courtesy of GEDmatch Genesis. 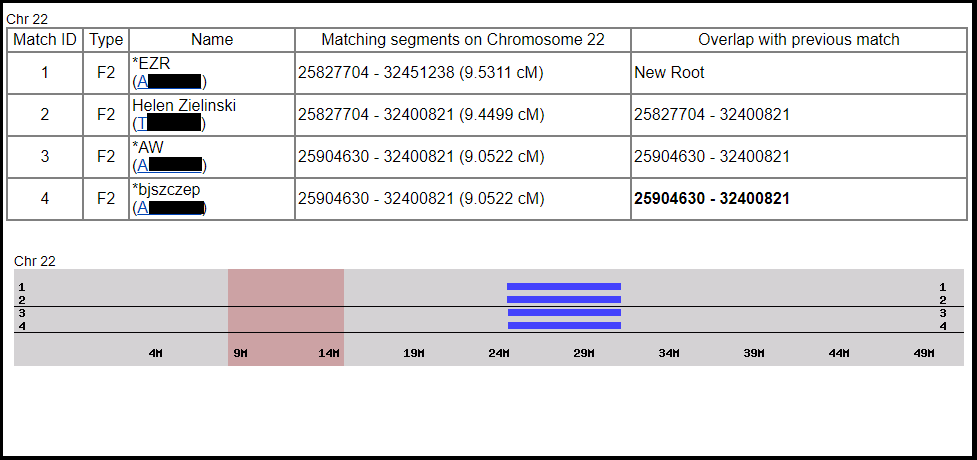
The segment is clearly IBD, identical by descent, because it was passed from Grandma to mom to my sister and me. However, thorough comparison of Czesław’s genealogy and Grandma’s offers no good clues regarding common surnames or places of origin. At best, this segment could be IBP, identical by population, since Grandma’s documented ancestry was entirely Polish and so was Czesław’s. However, I had the opportunity to discuss this example with genetic genealogist Blaine Bettinger over the summer, and he pointed out that the segment is still untrustworthy. Even though it’s IBD on my side, it’s possible that it’s still IBC, identical by chance, on Czesław’s side, and therefore a false positive. Of course, DNA evidence is always just one piece of the puzzle. If further documentary research turns up evidence of a shared surname or common place of origin between Grandma’s ancestors and Czesław’s, we might want to reevaluate this segment in that light. However, at present there’s no reason to believe there is any connection at all between my family and Czesław’s, so an exhaustive effort to seek documentary evidence is unwarranted.
Hopefully this discussion has helped at least a little bit with demystifying some of the concepts and terms used in genetic genealogy discussions, and explaining why autosomal DNA testing is such a powerful research tool. There are so many great resources out there to help educate budding genetic genealogists, including the list of some of my favorite blogs and Facebook groups included below, and with just a little effort, you, too, can grow comfortable with looking beyond your ethnicity estimates and incorporating DNA evidence into your research methodology. In my next post, I’ll offer some specific suggestions for working with your DNA match list at Ancestry so you can make the most of the information that’s provided there. Happy researching!
Sources:
1 Tim Janzen, “Autosomal DNA Testing Comparison Chart,” International Society of Genetic Genealogy Wiki, (https://isogg.org/wiki : 14 January 2019), licensed under CC BY-NC-SA 3.0.
2 Roberta Estes, “Concepts – Identical by…. Descent, State, Population, and Chance,” DNAeXplained – Genetic Genealogy, posted 10 March 2016 (https://dna-explained.com : 14 January 2019).
3 Catherine A. Ball, Matthew J. Barber, et. al, “Ancestry DNA Matching White Paper,” AncestryDNA, (https://www.ancestry.com/dna : 14 January 2019).
4 Tim Janzen, table relating “Length of Shared Segment” to “Likelihood You and Your Match Share a Common Ancestor Within 6 Generations,” “Identical by descent,” International Society of Genetic Genealogy Wiki, (https://isogg.org/wiki : 14 January 2019), licensed under CC BY-NC-SA 3.0.
5 “Identical by descent,” International Society of Genetic Genealogy Wiki, (https://isogg.org/wiki : 14 January 2019), licensed under CC BY-NC-SA 3.0.
For further reading:
The ISOGG Wiki (online encyclopedia of genetic genealogy, hosted by the International Society of Genetic Genealogy, or ISOGG) has articles on pretty much any topic of interest in the field of genetic genealogy and is highly recommended.
Blaine Bettinger’s blog, The Genetic Genealogist.
Kitty Cooper’s blog, Musings on Genealogy, Genetics and Gardening.
Roberta Estes’ blog, DNAeXplained.
Leah Larkin’s blog, The DNA Geek.
CeCe Moore’s blog, Your Genetic Genealogist.
Of interest to Polish-speakers is Eryk Jan Grzeszkowiak’s blog, Genealogia Genetyczna.
An even more comprehensive listing of popular genealogy blogs is found here.
In addition to these blogs, some of my favorite genetic genealogy Facebook groups are Genetic Genealogy Tips and Techniques, DNA Detectives, GEDmatch.com User Group, and AncestryDNA Matching. Be sure to also check Katherine R. Willson’s index of genealogy-related Facebook groups. At present, the list includes several pages of Facebook groups, although not all are focused on autosomal DNA testing.
© Julie Roberts Szczepankiewicz 2019


Thank You, very helpfull.
LikeLiked by 1 person
You’re welcome! Thanks for reading.
LikeLike
Here are my thoughts about your piece: https://wamahfm.blogspot.com/2019/01/great-overview-article-on-genetic.html In short, I think that your blog is superb, and this is a great entry.
LikeLiked by 1 person
Excellent blog!
LikeLike