
When it comes to genetic genealogy, it’s best to hope that each generation in your family tree was large, with lots of descendants living in countries where DNA testing is popular. Unfortunately, it doesn’t always work out that way. Small families, and families in which many of the distant cousins are living in a place where DNA testing is not as popular (e.g. Poland) make it difficult to find those DNA matches that can lead to breakthroughs in your research. Whether you know, or only suspect, that this is the case for your family, you can visualize the situation using some of the available tools out there, such as Leeds worksheets, and Collins-Leeds matrices.
What is the Leeds Method?
Back in 2018, which is a lifetime ago in the world of genetic genealogy, researcher Dana Leeds described her method for color-coding DNA matches using a spreadsheet, which she developed in order to help a client identify his biological family. Elegant in its simplicity, the Leeds Method took off, and it inspired a number of next-generation automated tools which cluster a tester’s DNA matches based on shared ancestry. Sites which offer autocluster tools include MyHeritage, DNAGedcom, Genetic Affairs, and GEDMatch, and AncestryDNA’s colored-dot grouping tool is also based on this method. With all these automated options available, it’s become a bit passé to create a Leeds Method spreadsheet manually. Nonetheless, I want to share one with you here, because it’s a compact visual aid for illustrating some “structural defects” in my mom’s family tree, and their impact on her DNA match list.
Figure 1 shows a Leeds Method worksheet created from my mother’s list of DNA matches on Ancestry.

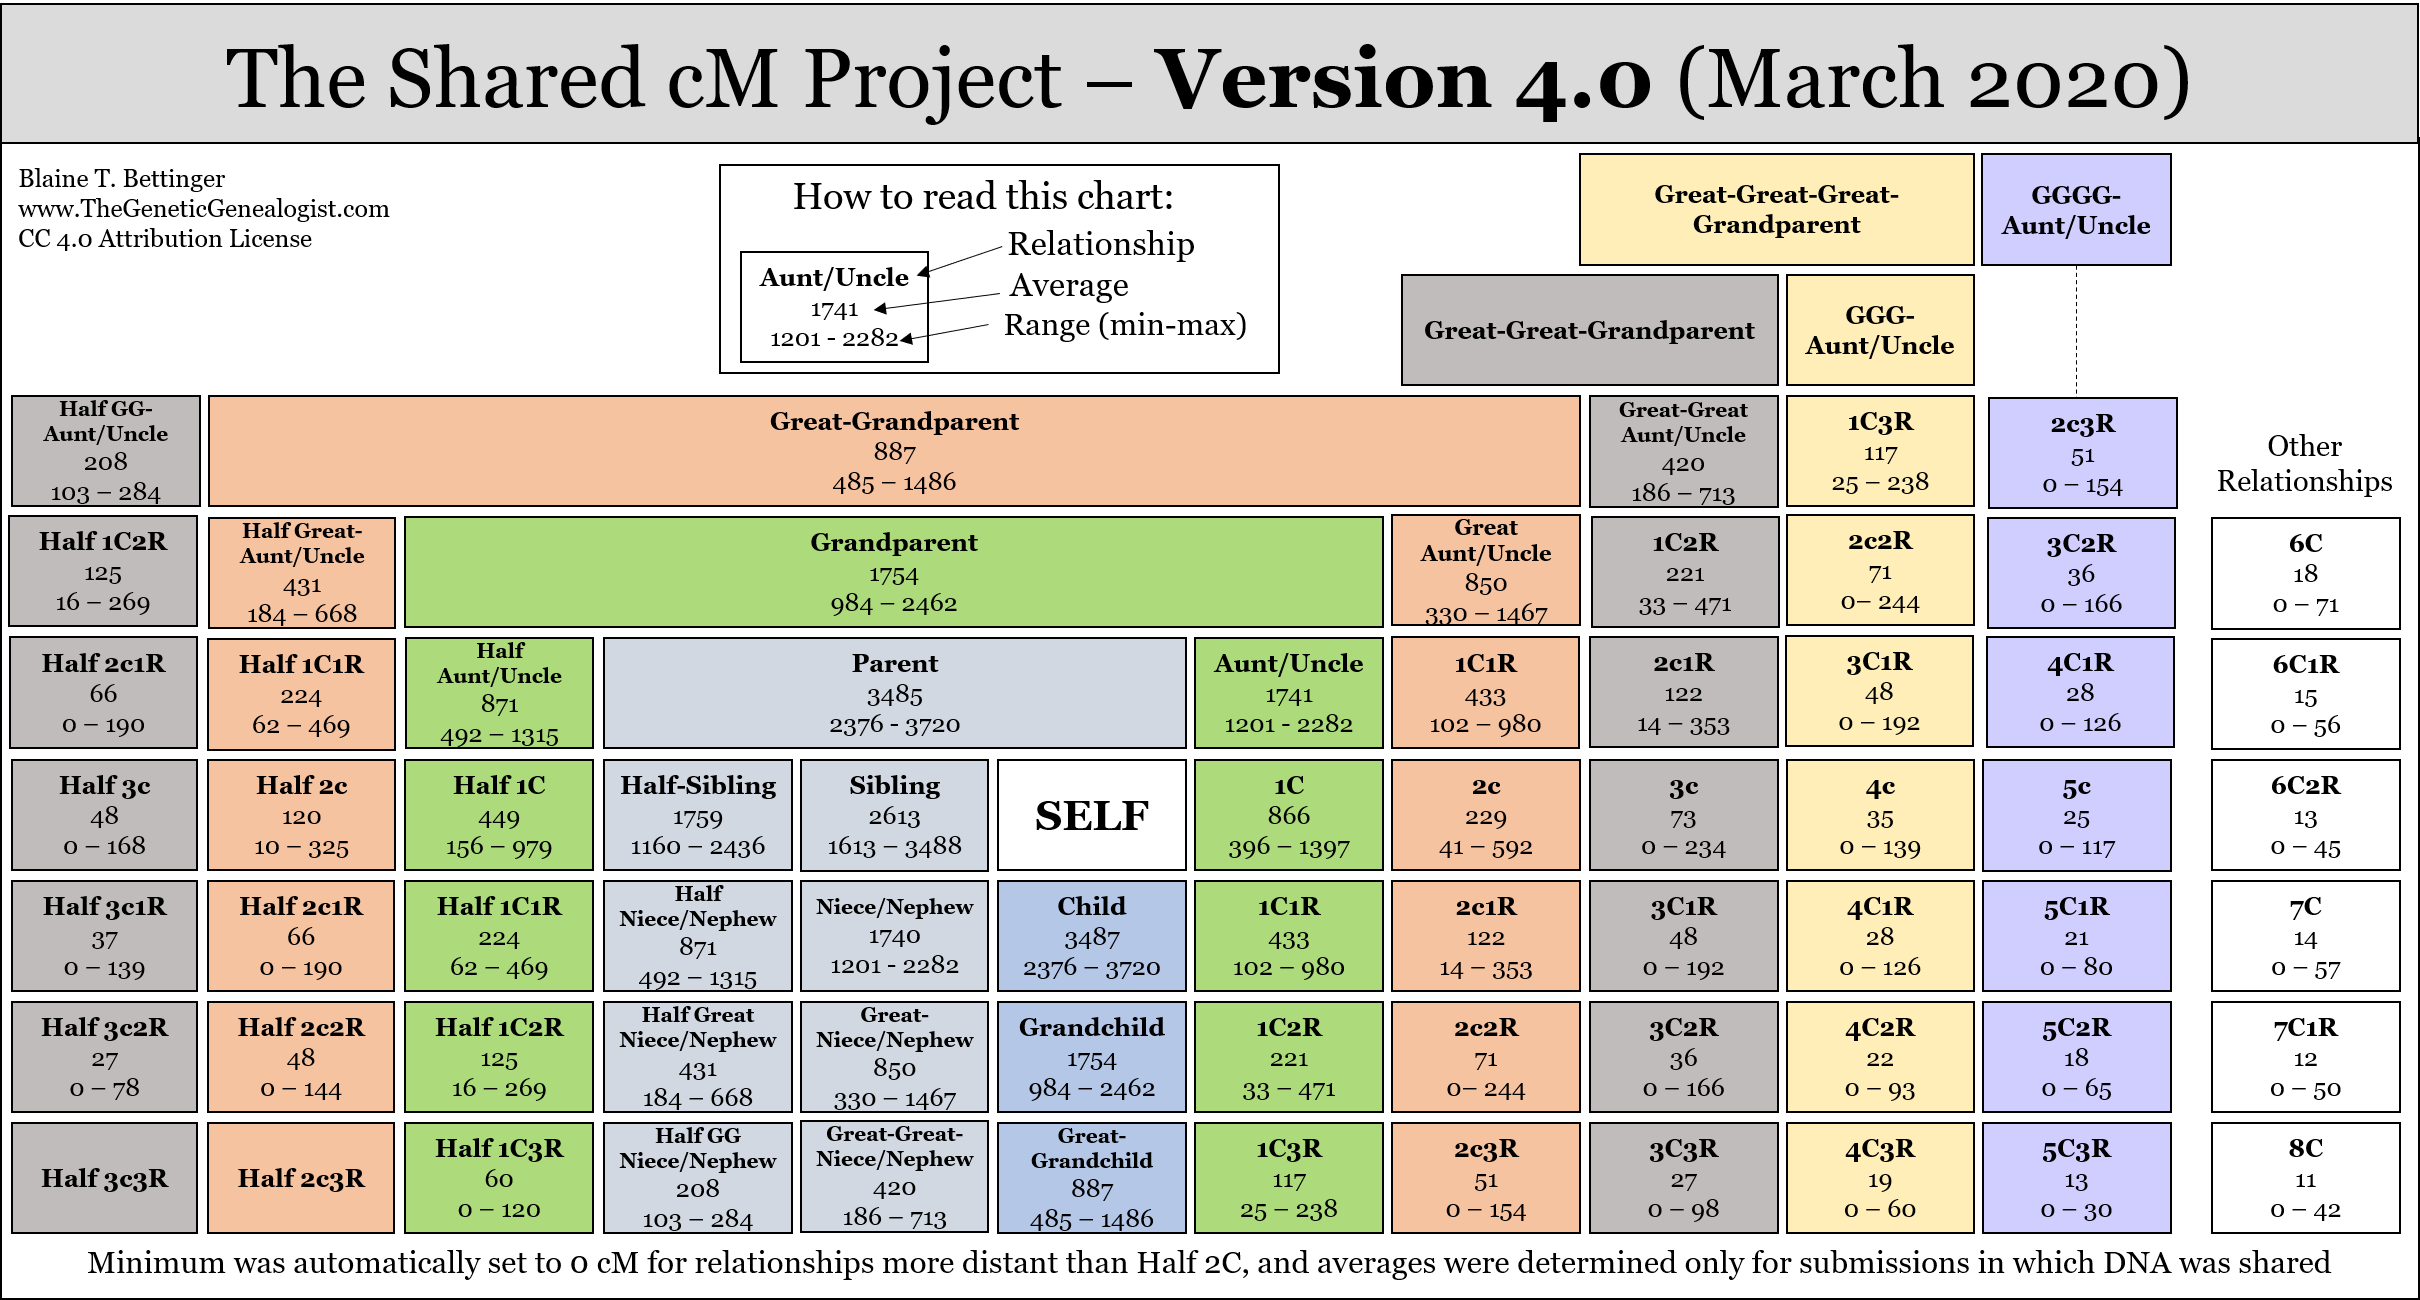
Leeds’ basic goal was to sort a list of DNA matches into four clusters, representing matches who are related to the tester through each of that person’s four grandparents. Individuals to whom we are related through only one of our four grandparents are our second cousins, so second cousins would be ideal test subjects for creating a Leeds worksheet. Thanks to the random nature of DNA inheritance, the amount of DNA shared between any two second cousins can vary, but typically, they share about 200 centiMorgans (cM) DNA, where a cM is the unit used to express genetic distance. (More cM shared = closer genetic relationship.) The exact amount of shared DNA between two second cousins can be as little as 41 cM, and as much as 592 cM, according to data gathered by Blaine Bettinger’s Shared cM Project.
With that in mind, Leeds opted to focus on DNA matches who shared between 90 cM and 400 cM DNA. Using her method, a color is assigned to the first match in the the list who shares between 90–400 cM with the tester, and then that same color is assigned to all the shared matches (or “in common with”) matches. This process is repeated until all the matches who share 90–400 cM have been assigned a color. Ideally, you want to exclude first cousins (1C), and descendants of first cousins (1C1R, 1C2R, etc.), because they will match you on two grandparents, not just one. This can be a little tricky if your family tree is not well-developed, because the amount of DNA shared between two people who are 1C1R, 1C2R, or 1C3R, can fall within that 90–400 cM range. However, the beauty of the Leeds Method is that it works even if you don’t know precisely how you’re related to someone, so having a few “mystery” matches in your worksheet that are 1C1R, etc., shouldn’t throw you off too much.
The 33 matches shown in Figure 1 were culled from my mom’s top 52 matches. Since I do know how most of my mom’s top matches are related to her, I took those first 52 matches and subtracted out all children, grandchildren, first cousins, and their descendants, who would match Mom on more than one grandparent. I removed the names of the DNA matches to protect their privacy, but they’re identified by the documentary relationship (if known), as well as by the amount of shared DNA in both cM and number of shared segments. The next ten columns, labelled 1 through 10, are the result of sorting Mom’s match list according to the Leeds Method. In column 1, the blue bars represent matches to whom Mom is related through one of the ancestors of her maternal grandmother, Veronica (née) Grzesiak. The red bars in column 2 represent matches to whom Mom is related through one of the ancestors of her paternal grandmother, Genevieve (née) Klaus. Columns 3 and 4 represent those matches to whom Mom is related through her paternal grandfathers, John Zazycki (purple bars) and Joseph Zielinski (green bars).
This brings us to the first observation I’d like to make. By looking at those four columns, it’s pretty clear that Mom has substantially more DNA matches who are related to her through the families of her grandmothers (Grzesiak and Klaus, blue and red), than she does through the families of her grandfathers (Zazycki and Zielinski, purple and green). She has exactly one match at this level who is related to her through John Zazycki: a 2C1R who is descended from John’s older sister, Marianna (née Zarzycka) Gruberska. Worse, I have to go all the way down to the level of a 4C2R to find a match that’s related to my mom through her grandfather Joseph Zielinski. The common ancestors between Mom and that match are my 6x-great-grandparents, Stanisław and Urszula Swięcicki, who lived back when there was still a Polish-Lithuanian Commonwealth, and who had already finished having children by the time of the final partition of Poland in 1795. (The story of that DNA match can be found here.) In other words, Mom has few-to-no “close” matches, depending on how you define “close,” who are related to her through either of her grandfathers.
So, what factors cause this phenomenon? In the case of the Zielinski family, my mother’s grandfather was the only one of the ten children in his family to survive long enough to marry and have children. This means that my mother has no second cousins who are related to her through her Zielinski family, and second cousins are what the Leeds Method hopes to exploit when developing initial groupings. The situation with the Zazycki family may be similar. My mother’s Zazycki grandfather, John, was one of eleven children, six of whom (including John) had children. John was the only one of his siblings to immigrate to the U.S., however, and it seems that not many of his siblings’ descendants opted to immigrate, either. Research is ongoing, but thus far it appears that only John’s eldest sister, Marianna Gruberska, had any children who immigrated. Presumably, the descendants of the other Zazycki (or Zarzycki) siblings remained in Poland. It may be that more of those Zarzycki relatives from Poland will start showing up in my DNA match lists, as DNA testing becomes more affordable and more popular among Poles. Time will tell. And If there are cousins in Poland who might be testing their DNA, it’s more likely that they’ll be showing up in DNA databases from MyHeritage and FamilyTree DNA, since those sites are are more popular than Ancestry DNA in Poland. So, I keep checking all the databases regularly, but thus far the situation has been similar in all of them, with few matches on the Zazycki and Zieliński sides.
Of course, any time one observes a lack of DNA matches to one particular line, there’s always the possibility of a misattributed parentage event, also known as a non-paternity event, or NPE. I’d be more likely to suspect this if Mom had no matches to a particular line, rather than a few distant ones. I’d be even more likely to suspect an NPE if I could find documentary evidence to suggest that a family was large and had plenty of descendants, and she still had no DNA matches. However, the fact that Mom has DNA matches to documented cousins on her Zielinski and Zazycki lines, and that the amount of DNA shared between her and those matches is within the expected range for the documented relationships, suggests that NPEs are not the issue here. (Or at least, it suggests that there are no NPEs that occurred in the generations between Mom and the ancestral couple shared between her and each DNA match.)
Rather than viewing the glass as half empty, it might be better to focus on all those DNA matches to the Grzesiak and Klaus families. Columns 5 through 10 indicate which matches are descendants of particular ancestral couples. In the case of the relatively close DNA matches shown in Figure 1, all but two of the Grzesiak matches are descendants of mom’s great-grandparents, Józef Grzesiak and Marianna Krawczyńska, as indicated by the light blue bars in column 5. The other two matches near the bottom, which are noted with a dark blue bar but not a light blue one, are not in my tree yet, so additional work is needed to make the documentary connection. However, we know they must be related somehow to the Grzesiak family because of all the matches they share in common with documented Grzesiak descendants. The Klaus matches are even more abundant, and can be broken down into descendants of various couples who were ancestors of either Andrzej Klaus, mom’s great-grandfather, or Marianna Łącka, mom’s great-grandmother.
Autoclusters: The Leeds Method on Steroids
Of course, thanks to the wonders of modern technology and gifted software engineers, we can go one better. Figure 2 shows a screenshot of the top portion of Mom’s autoclusters report at MyHeritage.

This utilizes the same principle as the Leeds Method spreadsheet, except it does the heavy lifting for you, automatically clustering your matches into groups which likely share a common ancestor. Each square on the grid represents a comparison of one of Mom’s DNA matches to another, and colored squares represent two people who match each other, in addition to matching my mom. You’ll note that there are some uncolored squares within each cluster; these occur because it’s possible that two members of a cluster will not match each other (even though they both match Mom) due to the random nature of DNA inheritance. So, I can gain insight into Mom’s relationship to all the members in the orange cluster shown in Figure 2, simply by determining her connection to one member of this cluster.
While it’s sometimes possible (e.g. with DNAGedcom) to vary the parameters for inclusion to create tighter or looser groups, that’s not possible with the autocluster tool at MyHeritage. MyHeritage utilizes an algorithm that automatically adjusts that parameters to yield the best clusters for each kit. Note also that not all of a tester’s matches will appear on the grid. MyHeritage provides a ReadMe file with each autocluster analysis which specifies the parameters that were used, the number of kits included in the analysis, and the names of DNA matches who were not included in the analysis as well. In my mom’s case, 109 DNA matches were used to create 26 clusters; 41 matches were excluded because they did not have any shared matches, and another 127 matches were excluded because, although they met the criteria for inclusion in the analysis, they would have ended up in singleton clusters (matching each other and Mom and no one else).
As MyHeritage states in their explanatory ReadMe file, “Everyone in a cluster will be on the same ancestral line, although the most recent common ancestor between any of the matches, and between you and any match, may vary. The generational level of the clusters may vary as well. One may be your paternal grandmother’s branch, and another may be your paternal great-grandfather’s branch.” This can be illustrated using the red cluster shown at the top left in Figure 2. This cluster represents 10 testers who are related to Mom through her grandmother, Weronika Grzesiak. I know how we’re related to eight of them: five of the matches share Weronika’s parents, Józef Grzesiak and Marianna Krawcyńska as the most recent common ancestral couple, and three share Józef Grzesiak’s maternal grandparents, Maciej Dąbrowski and Barbara Słońska, as the most recent common ancestral couple. Descendants of this couple were highlighted in light blue in Figure 1. So, the remaining two mystery matches in that red cluster shown in Figure 2 might be related to to Mom through a bit of DNA inherited from any of the ancestors of Weronika Grzesiak; we can’t really claim to know anything more definitive than that from these data.
The beauty of the autocluster option is that it eliminates the necessity of going through a match list by hand and tagging each match with a colored dot based on shared matches. Although the clusters themselves are extremely informative, it’s also worth noting the DNA matches who were omitted from the cluster analysis. In Mom’s case, one of the matches who was omitted due to lack of any shared matches was a 5th cousin who matches her through her Wilczek line. Since Mom descends from the Wilczeks through her paternal grandfather, it’s disappointing, but unsurprising, that there are no shared matches between Mom and her Wilczek 5th cousin, given the general lack of DNA matches who are related to Mom through either of her grandfathers.
Extrapolating to Other Surname Lines
For want of a better term, I’ll call the relative lack of DNA matches to Mom through either of her paternal grandfathers the “Small Family/International Family Effect.” Unfortunately, it seems to be at work on my Dad’s side of the family as well. I had high hopes that DNA testing might provide some clues regarding the birthplace in Ireland of my great-great-great-grandfather, Robert Walsh. Despite the fact that I’ve identified DNA matches with whom Robert Walsh and his wife, Elizabeth Hodgkinson, are the most recent common ancestors, DNA has not provided any strong leads to Walsh relatives in Ireland as of yet. I’ve even tested my father’s 100-year-old paternal aunt, whose great-grandfather was Robert Walsh. She would be expected to have more numerous and genetically closer DNA matches to this line than I would, since she inherited a greater percentage of Robert Walsh’s DNA. One might have expected that some of her matches would include Walshes from a particular location in Ireland, or even that one region of Ireland might stand out as an area from which a preponderance of DNA matches originated. However, no great leads have turned up yet. Similarly, DNA has not been especially illuminating as of yet with another brick wall ancestor, Maria Magdalena (née Causin/Casin/Couzens/Curzon) Roberts, who also seems to have come from a very small family which left few descendants. Does that mean that my DNA test results can’t help me? No, it just means that there’s nothing obvious to leverage, no low-hanging fruit to harvest.
There is hope, of course. By identifying “autoclusters of interest” that seem to share common ancestors on my brick-wall lines, I can examine their family trees of DNA matches within those clusters, or attempt to build family trees for them if none are available, and search for common surnames and ancestral locations. It should be noted that some sites (e.g. DNAGedcom) even have automated tools for identifying common ancestors based on GEDCOM files (family tree files) that are associated with DNA test kits. Another possible approach is to use research into an ancestor’s social network of friends, associates and neighbors (i.e. his “FAN club”) to identify putative parents for a brick-wall ancestor, trace their descendants forward to the present day, and then do autosomal target testing on individuals who would be predicted to share DNA, based on this hypothesis. Where there’s a will, there’s usually a way.
It can be incredibly rewarding to connect DNA matches to your family tree. Thanks to DNA matches, I’ve been able to discover and connect with distant cousins that I never knew I had, some of whom have even been willing to share old family photos. I’ve been able to track down a number of “lost” siblings of my ancestors who disappeared from the records. And DNA is an especially powerful tool when leveraged for tracking migrations of relatives with popular surnames. However, small families with few descendants can produce “lopsided” DNA match lists, which can be readily visualized using Leeds and Collins-Leeds clustering techniques. While these analytical methods won’t fix “structural defects” in your family tree, they can help you make the most of the matches you do have.
© Julie Roberts Szczepankiewicz 2021


Couldn’t open Fig 1!
Sent from my iPhone
>
LikeLike
Thank you for letting me know! The image is housed in my Google Drive and the link is set to “anyone on the internet can view,” so I’m not sure why this isn’t opening for you. I can try re-setting the link.
LikeLike
Julie,
Great post about the Leeds Method with your Polish family knowledge. I would be curious to see what happens when you add your DNA matches from MyHeritage, FTDNA, and 23andMe into your chart.
I can’t wait to see what you blog about next. Keep up the great work,
Paul Baltzer
LikeLiked by 1 person
Hi, Paul! I only had a chance to test my Mom with Ancestry and FTDNA before she passed away, although I did an autosomal transfer of her results to MyHeritage as well. So, matches from 23&Me are not available, but if you add in Mom’s matches from FTDNA and MH to that chart in Figure 1, down to the level of 48 cM, which is the lowest amount of shared DNA shown in the chart, there’s only one additional match that is unique to MyHeritage (and not duplicated in Ancestry) that would be added. The match shares 59 cM with Mom and matches her through the ancestors of Genevieve Klaus. She has no matches in the FTDNA database (down to 48 cM) that are not duplicated in Ancestry. There IS one interesting match that I discovered recently in the FTDNA database, who shares 17 cM with Mom and has ancestors from her ancestral parish of Młodzieszyn, which correlates with the DNA evidence indicating that the match is through her paternal grandfather (Joseph Zielinski). Records from Młodzieszyn are difficult to access, and we don’t have enough evidence at this point to know precisely how we’re related, but I’m hopeful that perhaps we can figure it out eventually. Thanks for your kind words about the blog post. It’s high praise, coming from such an accomplished and experienced genetic genealogist as you!
LikeLike